Infographic: Facts and Statistics about Packaging Waste in UK
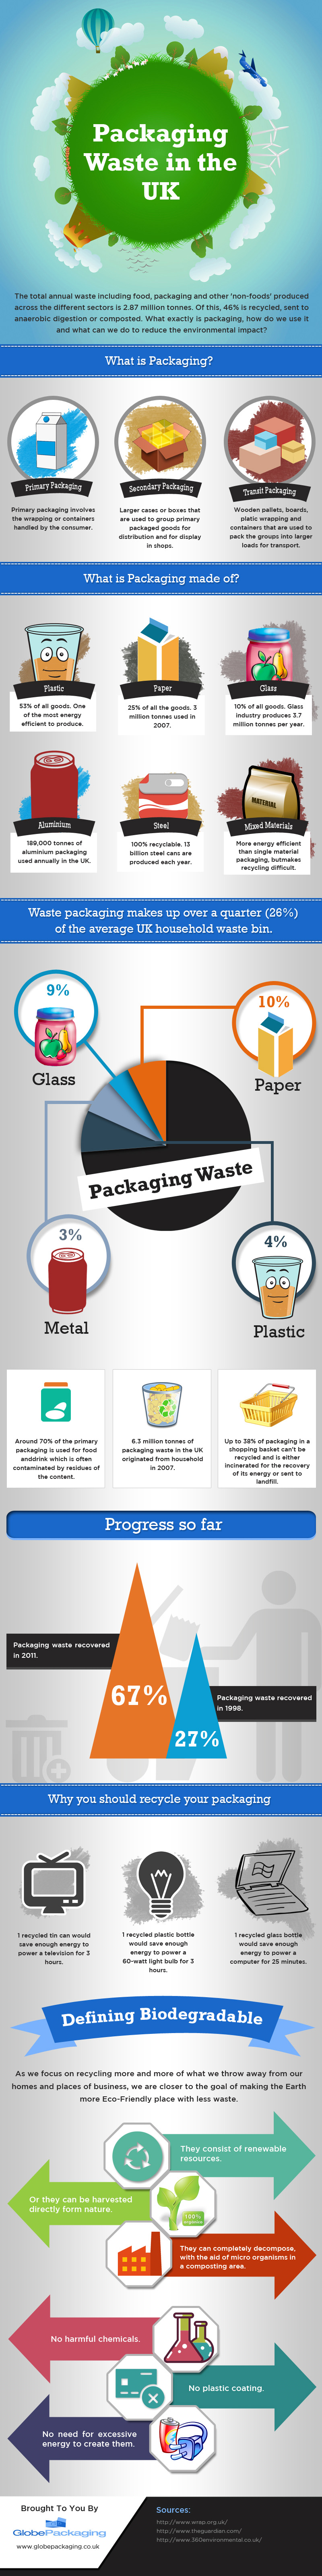
Right packaging is very important in order to keep your goods safe. Packaging proves helpful while transporting products from one place to another. There are three types of packaging namely primary, secondary and tertiary. Primary packaging contains the product. The packaging which contains the primary packaging is called secondary packaging. Likewise tertiary packaging contains the secondary packaging. After using the products, we throw away packages outside of our homes instead of reusing or recycling them. The total annual waste including packaging, food and “non-foods” generated across the various sectors is 2.87 million tonnes. Only 46% of this waste is recycled and rest goes to landfills.
What is packaging made of?
- Plastic: 53% of all goods are packed using plastic materials. Plastic packaging is available in different shapes and sizes.
- Paper: 25% of all goods are packed using paper. 3 million tonnes paper packaging was used in 2007.
- Glass: 10% of all goods are packed using glass. 3.7 million tonnes of glass packaging is produced every year.
- Aluminium: 189,000 tonnes of aluminium packaging is used annually in UK.
- Steel: 13 billion steel cans are produced each year.
Up to 38% of packaging in a shopping basket can’t be recycled. It is sent to landfills.
Industry is using various approaches to reduce the amount of packaging waste. They are now using eco friendly packaging. We can make the Earth more eco-friendly place by using the proper recycling techniques.
Below infographic, created by Globe Packaging, revolves around fact and statistics about packaging waste in UK.
Author Bio: Mark Dawson writes on the behalf of Globe Packaging, which is one of the leading suppliers of industry standard packaging materials.

